U.S. Whites More Solidly Republican in Recent Years
Jeffrey M. Jones, Gallup, March 24, 2014
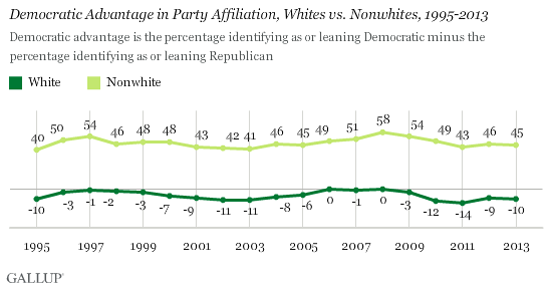
Whites and nonwhites have long shown differing political party preferences, with nonwhites widely favoring the Democratic Party and whites typically favoring the Republican Party by at least a small margin. In recent years, however, the margins in favor of the Republican Party among whites have been some of the largest.
The results are based on yearly aggregates of Gallup poll data since 1995, the first full year that Gallup regularly measured Hispanic ethnicity. For this analysis, Gallup defines whites as non-Hispanic whites, and nonwhites as blacks, Hispanics, Asians, and all other races combined.
The net Democratic advantage represents the percentage of each racial/ethnic group identifying as Democratic minus the percentage identifying as Republican. Positive scores indicate that a group is more Democratic than Republican; negative scores indicate the reverse. {snip}
{snip}
In recent years, party preferences have been more polarized than was the case in the 1990s and most of the 2000s. For example, in 2010, nonwhites’ net party identification and leanings showed a 49-point Democratic advantage, and whites were 12 percentage points more Republican than Democratic. The resulting 61-point racial and ethnic gap in party preferences is the largest Gallup has measured in the last 20 years. Since 2008, the racial gaps in party preferences have been 55 points or higher each year; prior to 2008, the gaps reached as high as 55 points only in 1997 and 2000.
{snip}
Over the last two decades, whites have tended to favor the Republican Party and nonwhites have overwhelmingly favored the Democratic Party. During the last few years, those racial and ethnic divisions have grown, mostly because whites have drifted more toward the GOP. Thus, party preferences by race during the Obama years, though similar in nature to the past, have seen some movement that has resulted in slightly greater racial polarization than before.
{snip}


