The Science of Human Intelligence
Jared Taylor, American Renaissance, February 7, 2025

Subscribe to future audio versions of AmRen articles here.
Richard J. Haier, et. al., The Science of Human Intelligence (second edition), Cambridge University Press, 2023, $64.99 (softcover) 423 pp.
The Science of Human Intelligence (hereinafter SHI) is the most comprehensive and up-to-date textbook on human intelligence now available. It is lavishly and usefully illustrated, and includes hundreds of full references to the original research on all key concepts. It is a serious book for serious students, but has been carefully edited to be fully accessible to non-specialists.

The lead author, Richard J. Haier, is one of the world’s top experts on the neuroscience of intelligence, and asks all the right questions: Is IQ real? Can it be increased? Are there different kinds of intelligence? How does the brain work? Which is more important: nature or nurture? Are all groups equal? Perhaps inevitably, the section on race is incomplete, sometimes timid, and includes a shocking error, but it clearly recognizes that race differences in IQ could have genetic causes.
The study of intelligence
The first words of this book are: “We are not equally intelligent.” Everyone used to know that, but today it is probably necessary to state the obvious. Intelligence is the most thoroughly studied aspect of personality, and people have valued it for millennia. SHI notes that the first standardized test for intellectual ability was introduced in the Sui dynasty (581–618) to select Chinese bureaucrats.
In the West, the first serious attempt to test for intelligence was by the Spaniard Huarte de San Juan, who wrote a book in 1575 called The Examination of Wits. Spain was managing a global empire, and San Juan wanted to find the smartest people for the hardest jobs. He thought this kind of matching would benefit all of society. SHI covers the important contributions of Francis Galton: the correlation coefficient, eugenics, applying the bell curve to distribution of intelligence. There is also a good description of Alfred Binet’s use of the first scientific IQ tests to determine which students in France needed remedial education.
During the First World War, the US Army had the same problem as the Chinese and the Spaniards: how to choose men for different jobs. It gave the Army Alpha test to nearly two million recruits, and it gave the Army Beta test — for illiterates and non-English-speakers — to 460,000.

The nature of intelligence
Intelligence is an example of what scientists call a latent variable: It cannot be measured directly, as height or weight can. SHI emphasizes that it must be approached scientifically: “Gurus are not permitted, and personal faith is never to be confused with evidence,” adding that “no variable can be admitted to a scientific theory if in principle that variable can never be measured.” The authors don’t say so, but “systemic racism” and “institutional bias” are perfect examples of fantasy variables. Scientists must be careful: “While an ideal study may be practically impossible to implement, a great deal can be learned from the accumulation of findings from less-than-ideal studies. This is called the weight of evidence” (emphasis in original).
With these rules in mind, SHI patiently demolishes the foolish but persistent ideas that intelligence can’t be defined, that IQ tests don’t measure it, and that tests are biased. The authors also explain the now generally accepted concept of g, or the general factor of intelligence. Our brains appear to operate according to a hierarchical structure, with g as the main engine that drives many different abilities that contribute to cognitive ability.

People with one high ability — for example, processing speed — tend to score well on other measures of intelligence, such as memory and learning. This correlation of abilities is called the “positive manifold,” and it reflects the power of g, as filtered through different specialized abilities. The authors note that training in particular skills can improve specific performances, but it does not raise g, just as “we cannot move the hand on the barometer in the hopes it will change the weather.”
We tend to think that intelligence tests measure complex skills, and they often do. A test for working memory, for example, might examine how well someone understands long, convoluted sentences. If he can’t keep all the words in working memory, he won’t know what the entire sentence means. Good IQ tests cover many abilities and yield scores for specific components of intelligence as well as for g.
However, what are called elementary cognitive tasks (ECTs) give surprisingly reliable results. Choice Reaction Time (CRT) is how long it takes someone to, for example, press different buttons depending on the colors of lights that flash on the screen. The more complicated the choice, the better the test of intelligence; CRTs can have a (negative) correlation of 0.6 to 0.7 with conventionally tested intelligence. Not surprisingly, ECTs that deal with letters or words test well for verbal ability and those that require quick decisions based on shapes and image orientation test well for non-verbal ability.
Intelligence researchers now have many ways to look inside the brain: CT scans, MRI, positron emission tomography (PET scanning), electroencephalography, and magnetoencephalography. Human brains have interconnection patterns that are as unique as fingerprints and can be used to estimate IQ — with correlations up to 0.5. The simplest measure of all — brain size — has a correlation with IQ of 0.33. Neuroimaging is only in the descriptive stage, however. We don’t yet know much about what is actually going on, but SHI says it is now possible to “imagine a brain scan that can predict important real-world outcomes better than IQ tests, the SAT or PISA [Program for International Student Assessment], or vocational testing.”
As Galton first pointed out, intelligence has a standard, Gaussian distribution; both very high and very low IQs that become increasingly rare at the tails of the curve. One in 100 white people has an IQ over 135. One in 10,000 has an IQ over 145, and three in 100,000 have an IQ of 160 or higher (0.003 percent). SHI notes that IQ does not have diminishing returns. The super-gifted consistently accomplish more than the merely gifted. There is no such thing as too much intelligence.

Genes vs. environment
For at least half a century, it has been one of the Left’s fondest beliefs that with the right childhood environment, everyone will grow up smart and successful, and that the children of rich people benefit from unfair advantages they got at home. It should therefore be government’s job to make sure everyone gets those advantages. The egalitarian impulse can be ruthless, and we have seen over and over how quickly it turns to tyranny when egalitarians have power.
Now, in what SHI calls “one of the most important findings in psychology,” the power of household environment — and therefore the scope for government intervention — has been definitively disproven. Countless studies have found that the home in which you grow up — what is called your “shared environment,” because it is shared with family members — can somewhat raise IQ scores in childhood, but by adolescence, its effect disappears.
There are three influences on IQ and other aspects of personality: genes, shared environment, and “unshared environment” — experiences outside the home. This table shows that at age five, shared environment (the orange bar) accounts — on average — for fully half of the variance in individual IQ scores. That percentage decreases and is gone by age 16, completely replaced by unshared environment (in gray).

The genetic influence (in blue) steadily increases to an average of 88 percent of the variance by age 26. SHI notes that “as children grow up, they increasingly select, modify and even create their own experiences in part based on their genetic propensities,” thus negating the effects of family. The strongest influences in the non-shared environment seem to be the friends children make, and their effect is strongest in high school. Thus, we now know that genes contribute most to how smart you are, and that the heritability of intelligence depends on the age at which it is measured.
How do we know this? One of the early, eye-opening studies was the Texas Adoption Project from the 1980s. It found that in childhood, there was a modest IQ correlation of 0.12 between the adopting mother and the adopted child, but by adolescence, the correlation had dropped to 0.02. The mother and child were essentially no more similar than any two people chosen at random. However, by adolescence, the IQ correlation with the birth mother — who had no influence on child-rearing — was a substantial 0.45.
Even more convincing were the results of the famous Minnesota Study of Twins Raised Apart (MISTRA), conducted by Thomas J. Bouchard, which ran from 1979 to 1999. This was a near-perfect natural experiment. Prof. Bouchard found identical twins who were separated at birth and grew up in different homes, and determined how similar they were. Because their environments were different and because they often didn’t even know of the existence of the other twin, their similarities as adults had to be mostly due to genes. MISTRA found 81 such pairs, and compared them to 56 pairs of non-identical, separated twins as controls.
The identical twins were so similar in tested intelligence that their score differences were often no greater than the variation in scores the same person might get taking the same test on different days. Other similarities were often startling:
One pair of MZA men had been overweight until middle school and then became quite thin. They had speech problems for which they received therapy in kindergarten or grade school. Both were diagnosed as hyperactive at about the same age, and both were actively and openly homosexual.
SHI notes that:
Especially in the early years, government grant money for this important research was not forthcoming, largely because of political reaction against the idea that intelligence could be influenced by genetics. The early work was supported by foundations.
SHI coyly refrains from naming the foundation that played a key role in both the Texas study and MISTRA: the Pioneer Fund, which lefties call “racist.” Prof. Bouchard has said, “If not for Pioneer we would have folded long ago.”
Egalitarians have tried to equalize IQs through “early interventions” that varied in intensity from Head Start to immersive efforts such as the Perry Preschool Project and the Abecedarian Project — both of which made promising claims but were found to have flawed designs. SHI is unequivocal: “No long-lasting increases to g, based on multiple measures, have been demonstrated in replicated intervention studies to date once the intervention ends.”
One measure of environmental impact is the effects of teacher and school quality on student grades. SHI reports that intelligence is the single best predictor of grades, accounting for 64 percent of variance. Conscientiousness accounts for another 28 percent, leaving only about 10 percent for school quality.
Intelligence generally limits what a person can do, but whether he will do it is a question of something different: motivation or conscientiousness. SHI warns not to confuse intelligence and other aspects of personality.
Another finding is that even before intelligence can be reliably tested, babies vary in how curious they are, and in how much they seek stimulation and new experiences. Curious, novelty-seeking babies are later found to have higher IQs than babies that are not. This is true for boys and girls, for different children in the same family, and for babies at all socioeconomic levels.
Intelligence can be remarkably resilient. During the Second World War, there was a six-month period of near-starvation in the Netherlands because of a German blockade. Estimated daily caloric intake was only 640 calories per adult. Surprisingly, this had no measurable effect on the adult IQs of people who were neonates or in utero during that period.
Even those who understand the genetic contribution to IQ prefer to think that intelligence is similar to the risk for heart disease. Even for people with genetic conditions that make heart failure more likely can improve their health through exercise, diet, drugs, and surgery. There seems to be no equivalent for permanently increasing IQ, but people still make spectacular claims. In 1993 there was a highly-touted — and later completely debunked — finding that playing Mozart for babies increased their intelligence. SHI notes that in 2016, the company Luminosity paid a $2 million fine after the FTC accused it of deceptive advertising when it claimed its “brain training” program could improve IQ.
So long as people get a decent childhood diet and don’t grow up in severe sensory deprivation, there doesn’t seem to be any reliable way permanently to increase IQ. Surprisingly, SHI is silent on the effect of breastfeeding, which the World Health Organization claims increases IQ. SHI concludes: “There is little progress identifying specific aspects of the environment that foster intellectual development.”
In what is known as the “Flynn effect,” it is generally recognized that IQ scores have been rising for the last several decades. Many have tried to argue that this proves the power of environment on IQ. Mainly, the rise appears to reflect better prenatal and early postnatal nutrition and improved healthcare, and the rise has stopped in developed countries.
SHI concludes that we now have all the evidence we need of the genetic impact on intelligence and that any further advances will come from brain studies. They note that scientists initially assumed that it would be easy to find the genes for intelligence. One reason was that it was possible to improve the ability of mice to find their way through mazes by splicing a single gene — NR2B — into their brains. However, we now know that, at the very least, there are hundreds of genes that contribute to intelligence and that each has only a small effect. At the other extreme, there are more than 300 known genetic conditions that virtually guarantee mental retardation. However, most of the people who are at the bottom of their classes or in remedial programs do not have these conditions. They were unlucky in the genetic lottery and are at the low end of the normal IQ distribution.
Sex differences
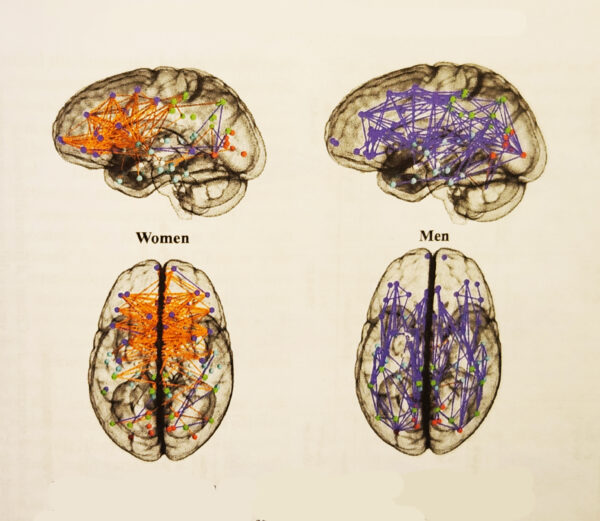
SHI is unequivocal: On average, men are slightly more intelligent than women, and they are better at mathematical/spatial reasoning. On average, women have better verbal ability. There is also a broader natural distribution of male vs. female intelligence, with more male geniuses and more male dummies.
Imaging techniques can now unerringly distinguish between male and female brains, and these differences are already visible in the brains of fetuses in the womb. This image shows how differently male and female brains are wired. Orange lines are communication between brain hemispheres and blue lines run within hemispheres. Women routinely use both sides of the brain at times when men use only one.
SHI also notes that there are consistent sex differences in patterns of mental disorder. Men are more likely to have autism, schizophrenia, dyslexia, and ADHD. Women are more likely to have Alzheimer’s, severe depression, anxiety, and eating disorders.
Women mature earlier. They generally enter puberty between the ages of eight to 13, and reach full height at 14 to 15. Boys enter puberty some two years later than girls, and also reach full height two years later.
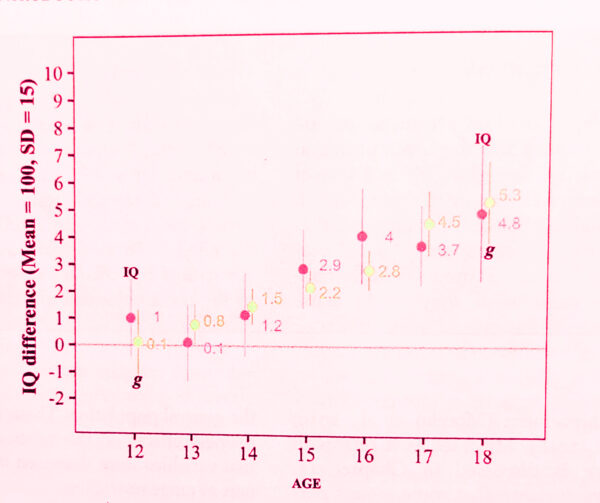
Intelligence appears to develop at a similar pace. Until adolescence, girls, on average, are just as smart as boys — in some cases smarter — just as it is not unusual for girls to be taller than boys. This graph shows the male advantage (IQ scores red, estimated g pale green) gradually rising from age 12 to age 18.
The following graph shows boy/girl differences in IQ distribution from a 1932 assessment of every Scottish 11-year-old. The black line is boys, the dotted line is girls. Boys accounted for nearly 60 percent of the lowest-IQ children, but also nearly 60 percent of those with the highest IQs.
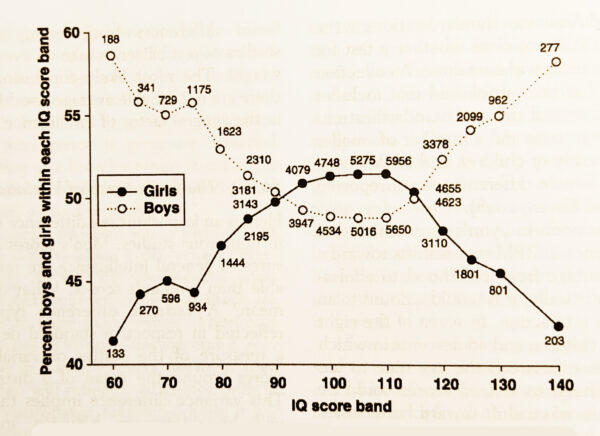
Boys are about twice as likely as girls to have low IQs in the normal range, and they are also more likely to be diagnosed with outright mental disability. However, men are an estimated 11 times more likely to have IQs of 160 or higher.
The reason for the greater distribution of intelligence is not known, but SHI suggests it may be because men have only one X chromosome while women have two. If some of the genes for intelligence are carried on the X, it would mean men have a smaller and therefore more variable sample of them. Also, variation on the X in a male — whether it increases or decreases intelligence — is expressed fully because he does not have a second X that might balance or mask the effect.
Today in the United States, women are more likely than men to go to college: They are 60 percent of college students. Because men — like college students — are overrepresented at the high end of the IQ bell curve, and because a smaller, more intelligent fraction of those smart men are in college, on average, college men are considerably smarter than college women.
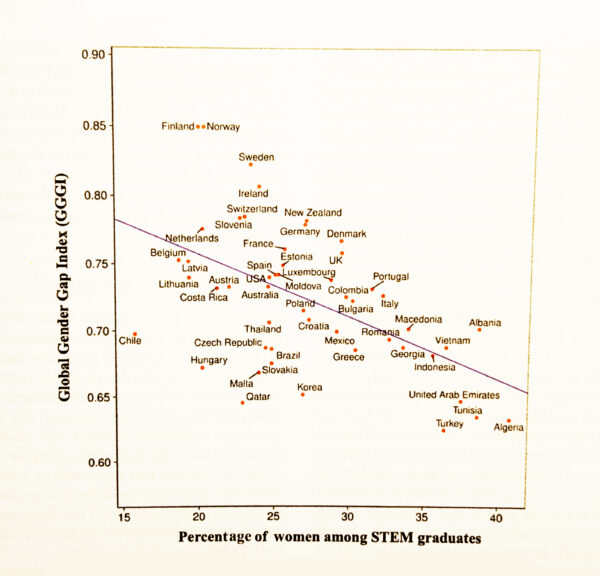
Men and women do not have identical ambitions. Men tend to want jobs that involve “things” — engineering, programming, fixing machinery, whereas women like jobs involving “people” — teaching, social work, personnel. Feminists argue that this is only because of arbitrary “sexist” norms.
This graph depicts an apparent paradox. Along the x-axis, it shows the percentages of STEM degrees awarded to women in different countries. In none do women get more than half, but the highest percentage of STEM degrees go to women in countries we think of as having traditional sex roles: Algeria, Turkey, Tunisia, Albania. In Western countries, where women presumably have greater freedom to choose their degrees, fewer earn STEM degrees.
SHI warns against expecting men and women to fill the same roles:
In every society, there are sexual differences that go beyond the childbearing difference forced by biology. Evolutionary psychologists suggest that these differences can be traced to a natural selection advantage held by groups that, in prehistoric times, assigned the hunting role to stronger males and the gatherer-childcare roll to females . . . . [W]oman’s superior verbal abilities are explained by the assumption that women, being more dependent on others for protection of themselves and their offspring, had to be superior in social interchanges.
SHI even includes a sympathetic discussion of the persecution of then-president of Harvard, Lawrence Summers, when he suggested — reasonably and delicately — that sexism might not explain why there were so few women at the top level in science. SHI notes that even the small number of women who have the capacity for top-flight science go into other fields because they enjoy them more. But it’s dangerous to say so. The authors cite the case of James Damore, a Google engineer who was fired for saying that smart women might want to go into people-oriented fields such as medicine or law rather than programming.
Of course, talking about race differences is even more dangerous.
Race differences
First, and laudably, SHI is blunt: “There are intelligence differences among populations, especially groups of distinguishable ancestry.” This graph of white (AEA), Hispanic (AHA), and black (AAA) averages leaves no doubt:

There is no guff in this book about race as a “social construct,” and the authors at least leave open the possibility that genes contribute to these differences. They warn about liberal hysteria: “[E]ven the suggestion that there is a genetic component to group differences may contribute to a lack of enthusiasm for genetic research on intelligence in general.” SHI quotes Prof. Linda Gottfredson of the University of Delaware: “[T]he implicit premise seems to be that unsettling truths do no good and comforting lies no harm.” “[M]ere theoretical possibility elevates the scientific credibility of a politically popular idea above that of an empirically plausible but unpopular conclusion.”
SHI gives Stephen Jay Gould and his crudely egalitarian The Mismeasure of Man the hiding they deserve: “Gould had many facts just plain wrong and worse, when confronted with detailed technical refutations of his key points . . . [he] declined to correct his mistakes or modify his opinions.” SHI also squashes liberal excuses: that non-whites suffer from “stereotype threat” that makes them choke when they take tests; that there are “multiple intelligences” and that non-whites score better than whites on the supposed intelligences that IQ tests don’t measure.
SHI doesn’t even hide behind the argument that “even if there are group differences they don’t really matter.” It notes that society routinely makes group-based decisions: You can’t drive or vote before a certain age, and there is mandatory retirement for airline pilots after a certain age. Race has similar implications: “Should the best people be selected, regardless of group membership, or should some effort be made to balance rates of acceptance across groups? This is a policy issue, not a scientific one.”
SHI is on the right side of this question: “[T]here is a point of view that researchers should avoid investigating group differences because nothing good could come of it . . . . [H]owever, we think it is better to have accurate information than not.”
But the book also goes squishy: “Somehow a balance must be found between the need for free exchange of research results among scientists concerned with intelligence and the need to be sure that no segment of our society has reason to feel threatened by the research or its publication.” If scientists worry about who might feel “threatened,” they’ll never study anything.
This may be worse: If it turns out that genes contribute to race differences then “there also likely could be extreme misuses of such information, so public discussion and education by scientists are critical for clarifying what the data mean and do not mean.” Anyone who understands averages will understand what they mean.
The authors were brave about sex; race is still a minefield. What are we to make of this? It is a useful illustration of the real-world effects of different levels of IQ that SHI cites as “adapted” from work by Linda Gottfredson.
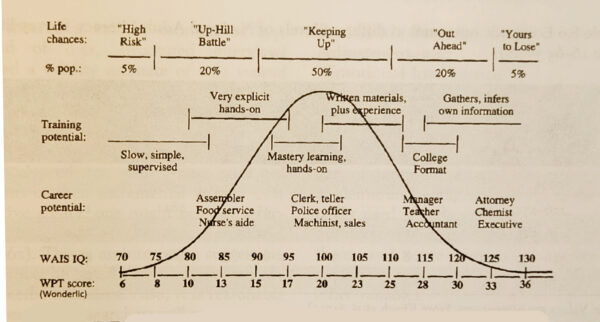
Boy, was it “adapted.” This is the original, clearly meant to explain how race differences in IQ affect real-world achievement.

SHI bowdlerized what I consider to be one of the most important graphs in all of psychological literature.
There is an outright error in the SHI report on the important Minnesota Transracial Adoption Study that ran through the 1970s and ’80s, and was funded by NIH. The subjects were white, mulatto, and black children adopted by high-IQ white families, and NIH hoped to show that with equally favorable home environments, race differences in IQ would disappear — or at least be greatly reduced. There was much rejoicing at the findings at age seven: The adopted children of all races had higher IQs compared to children in the general population. Good homes seemed to make an enormous difference.
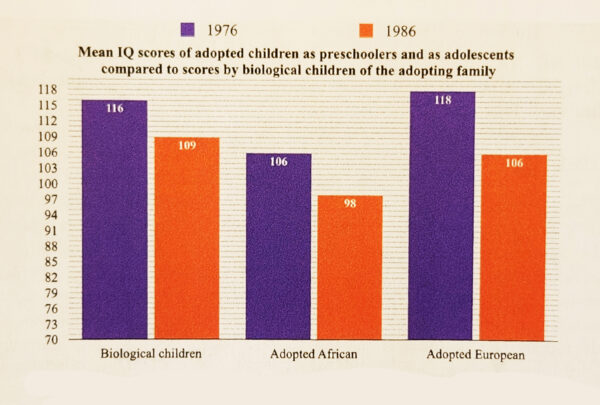
Purple bars are IQs at age 7. Biological children are included but not the mulatto children. By age 17 — the IQs reported in the orange bars — the effect of “shared environment” had greatly decreased, just as we would expect from what we now know about how heritability increases into adolescence. However, the figures for “Adopted Africans” in this graph are badly wrong. Ninety-eight, reported as the average IQ at age 17, was the average at age seven, and the average at age 17 was only 89. This is a serious and inexplicable error in a book that seems very careful about accuracy.
If growing up in a high-IQ white household really had raised the adolescent IQ scores of black children by 13 points — from an expected black average of 85 to just two points below the white average — that would have been a stupendous achievement. The adolescent black average of 89 actually reported in the study was four points higher than the national black average, and was perhaps a result of growing up with smart whites. However, 89 may be no higher than the average for blacks in Minnesota, who perform better than blacks, nationally.
One of the adoption-study researchers was Prof. Sandra Scarr of Yale and U Penn. When she reported on the age-17 data, she tried manfully to argue that it supported an environmental explanation for the differences. Later, she confessed that she had “tried to make the results palatable to environmentally committed colleagues. In retrospect, this was a mistake. The results of the transracial adoption study can be used to support either a genetic difference hypothesis or an environmental difference one (because the children have visible African ancestry).” The argument in parentheses is that because the black children were obviously black, this could have prompted enough “racism” in the environment to push down their IQs. Those who find that argument plausible are welcome to it.
Earlier in the book, SHI notes the correlation between brain size and intelligence. Somehow, it fails to mention the well-established race differences in brain size: East Asians have the largest brains and Africans the smallest.
SHI finally concludes: “The idea that environment and culture explain 100% of group differences in average intelligence is a reasonable hypothesis.” Is it, really? One hundred percent? I don’t think that is a fair reading of the data, but at least SHI leaves open the possibility that some (or even most) of the difference is genetic.
Aging
Bad news, old folks: Your brain is wearing out, just like the rest of you.
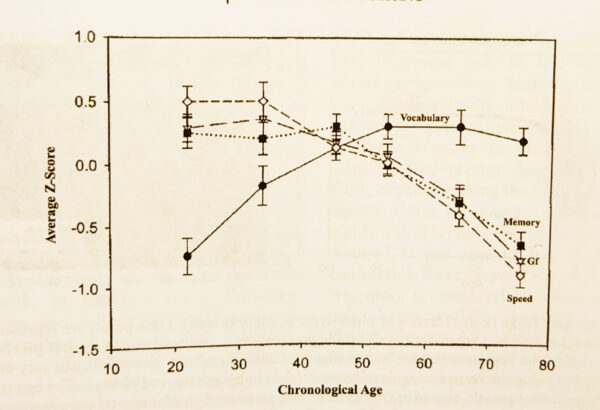
This graph shows declines, measured in standard deviations, of different aspects of intelligence. Processing speed, which starts out the highest on the left, declines nearly two standard deviations from the 30s into the 70s. Memory and fluid intelligence (Gf) also drop sharply, though not as much. Fluid intelligence is the ability to deal with entirely new intellectual challenges, as opposed to crystalized intelligence, (Gc) which is how well you apply knowledge to problems. Gc, not graphed here, declines much more slowly than Gf, which is why older people can still make good judgments in conventional situations.
Interestingly, vocabulary can increase and hold steady into the 60s, and need not decline much from its peak. Verbal ability generally holds up well, which is why older people whose IQs have declined considerably over the decades, can still cut an impressive figure.
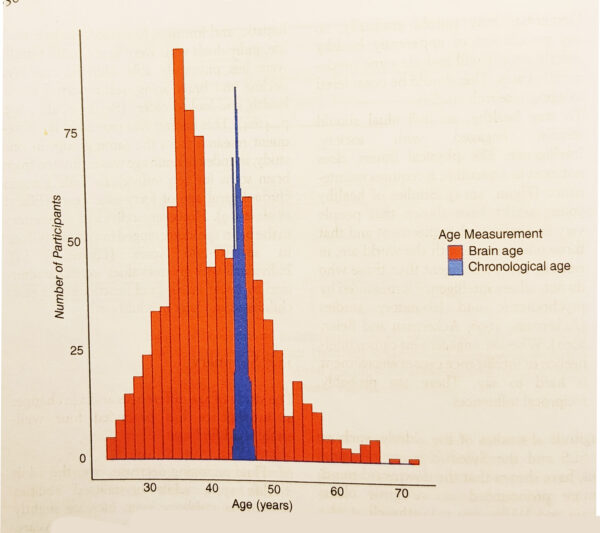
There is great individual variability, however, in the rates of decline, and brain scans can detect clear differences between vigorous and aging brains. The blue bars in the graph above are the distributions of the chronological ages of subjects who were 44 or 45 years old. The orange bars are the ages of their brains as determined by scans. Some middle-aged subjects had brains that appeared to be those of people in their 20s, while others’ brains appeared decades older. SHI does not explain the unexpected brain-age grouping around age 35. It appears that the genetic variants associated with high intelligence are also associated with better aging, so even though smart people decline intellectually, they do so more slowly than others.
SHI notes that the rate of cognitive decline is related to other kinds of decline: “Before midlife, individuals who were aging more rapidly were less physically able, showed cognitive decline in brain aging, self reported worse health, and looked older.”
A high IQ helps you live longer.

These two graphs plot the ages at death of 2,200 high- and low-IQ Scottish children tested at age 11. Curiously, the IQ effect on health seems to have been stronger and more consistent for women.
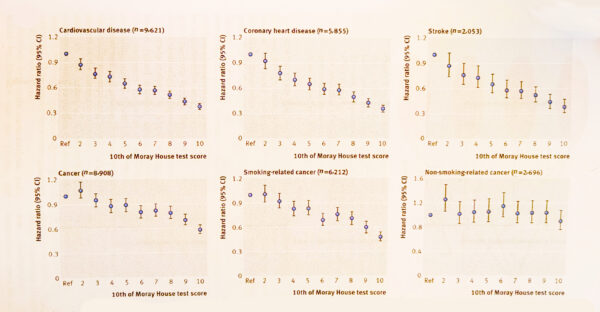
The more intelligent you are, the less likely you are to die in an accident, including a car wreck. The graphs below show the relationship between IQ and various other causes of death. The Ref numbers along the x axes are IQ score deciles, and the higher the data point on the y axes, the greater the likelihood of death from those causes. Non-smoking-related cancers in the lower right seem to be impervious to IQ. It may be that genes for high IQ are related to genes for longevity, but these data strongly suggest that smarter people are more likely to take better care of themselves. Cancer, however, can kill anyone.
IQ and society
SHI is vividly aware of the social value of high intelligence: “On a national basis, an average IQ estimate is a good predictor of socioeconomic indicators of quality of life.” And later: “Extraordinary economies are created by extraordinary minds. More than ever, the strength of countries and their competitiveness depends on exceptional human capital.”
Remarkably, SHI cites calculations from The Bell Curve, written by Charles Murray and Richard Herrnstein in 1994: What would happen if the average IQ of the United States rose by just three points, shifting the entire IQ distribution to the right? The poverty rate would fall by 25 percent, incarceration by 28 percent, and dropout rates by 28 percent. “Imagine,” writes SHI, “what might result if a population average were to increase by a full standard deviation (15 points).” The authors write that “in the long run, intelligence may be what matters most for individuals and for countries.” They never suggest eugenic policies; instead, they ask us to imagine “a drug that changes synaptic function or brain circuit efficiency or increases information-processing capacity by stimulating gray matter volume or white matter connectivity and function.”
It is hard to disagree with SHI’s warning that “Understanding the cascade of events from DNA to genes to protons to neurons . . . may be the most formidable challenge in science, and one with the most profound consequences.” Needless to say, this is not a national priority — not even a legitimate subject of discussion — in the United States, but other countries are not so squeamish. The Cognitive Genomics Project of the Chinese BGI Group is quietly mapping the genes for intelligence and trying to figure out how to make Chinese smarter. I doubt they will share their findings with us.
It is refreshing to find that this major scholarly work — published by one of the world’s most prestigious publishers — takes such solid positions on so many controversial questions. Its limitations on race differences were perhaps inevitable, but will not confuse anyone who understands the rest of the book. Perhaps future editions will be bolder; surely they will get the Minnesota Transracial Adoption Study right.